Domains52 shared servers run CloudLinux. CloudLinux monitors and regulates account resource usage to help improve server performance and stability.
cPanel enables you to view detailed information about problematic processes and database queries running on your account. This information is very helpful for determining why a CloudLinux resource limit was triggered.
| CloudLinux checks running processes every minute. Because CloudLinux does not check processes every second, it is possible that short intervals of high usage can be missed. |
Viewing resource limit information
To view resource limit information for your account, follow these steps:
1. Log in to cPanel.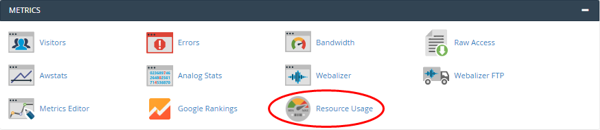
- Your site had no issues in the past 24 hours: If you receive this message, your account did not trigger any limits within the past 24 hours.
- Your site has been limited within the past 24 hours: If you receive this message, your account triggered at least one resource limit within the past 24 hours. cPanel displays additional information about which resource (or resources) triggered the limit.
- Your site might hit resource limits soon: This message is a warning that your account may trigger resource limiting in the near future. cPanel displays additional information about which resource is at risk of triggering a limit.
4. To view detailed resource usage information for your account, click the button or click the Current Usage tab. cPanel displays usage graphs and a usage table:
- By default, cPanel displays resource usage information for the current day. To change the time interval displayed, in the Timeframe list box, select the range of time to be displayed. In the Time Unit listbox, select the interval between the data points to be displayed.
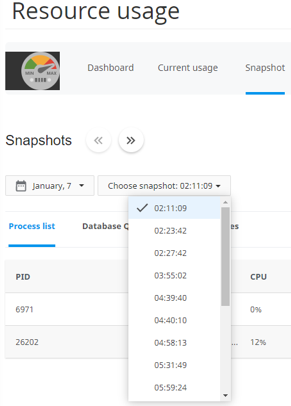
5. To view resource usage snapshots, click the Snapshot tab. Depending on your account's resource usage, cPanel may display a list of processes and a list of database queries:
- Use the arrow buttons to view snapshots in sequence.
- Use the calendar list box to select a specific date to view.
- Use the Snapsot list box to select the snapshot for a specific time to view:
Snapshot example
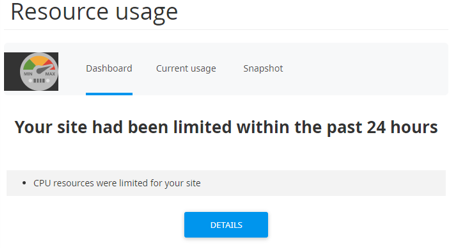
Let's look at an actual limiting scenario and see how snapshots help troubleshoot the problem. In this example, an account has had its CPU resources limited sometime within the past 24 hours:
To view additional information about the resource limiting, as well as when it occurred, click the Snapshot tab. The following page appears:
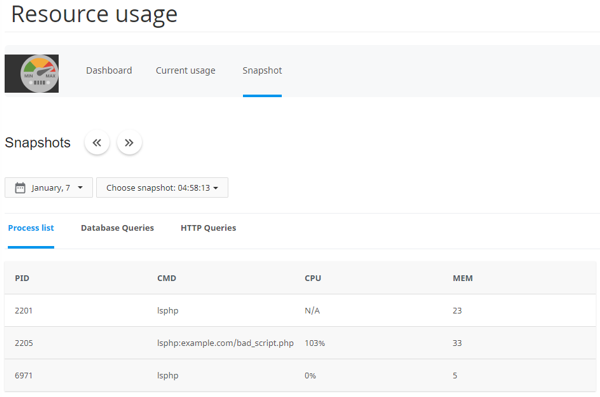
On the Process List tab, the following information is shown:
- PID: This is the process ID.
- CMD: This is the actual command that the process ran.
- CPU: This is the CPU usage for the process. In this case, bad_script.php exceeded CPU capacity twice (102% and 101%).
- MEM: This is the amount of memory used by the process, in megabytes.
From this information, we can determine that the PHP script bad_script.php has some sort of problem that causes it to use a large amount of CPU capacity.


